How to Understand Data in the Shopping Campaign Reports
The Shopping Behaviour Analysis reports holds a tremendous amount of insights and most marketers and analysts only scratch the surface, let’s change that. For demonstration purposes the Google Analytics Demo Account and Google Merchandise Store was used.
Prerequisites to Get Started
The correct implementation of Enhanced Ecommerce is a must if you want to answer your burning customer intention and performance questions based on GA data.
The basic view Ecommerce settings need to be configured properly:
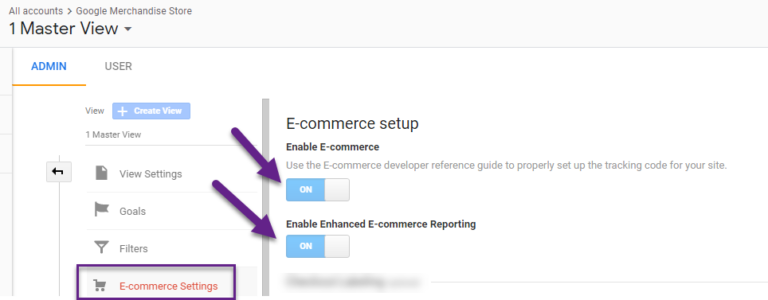
From a coding perspective, here is what you should implement at a minimum:
- Product View tracking
- Add-to-Cart tracking
- Checkout tracking
- Transaction tracking
You will want to sit down with your developers to get the job done. David Vallejo has released a great Google Tag Manager extension. You can get your free copy of GTM Debug here.

There are definitely more GA & GTM tools out there, but this Chrome extension will be a great help in debugging and fixing Enhanced Ecommerce issues.
How to Interpret the Report Data
I have found there is quite a bit confusion when interpreting the Shopping Behaviour Analysis report in Google Analytics. If you want to follow what I am doing:
- Get access to the Google Analytics Demo Account.
- Select period: 1 Jun 2018 – 30 Jun 2018.
- Navigate to Conversions > E-commerce > Shopping Behaviour.
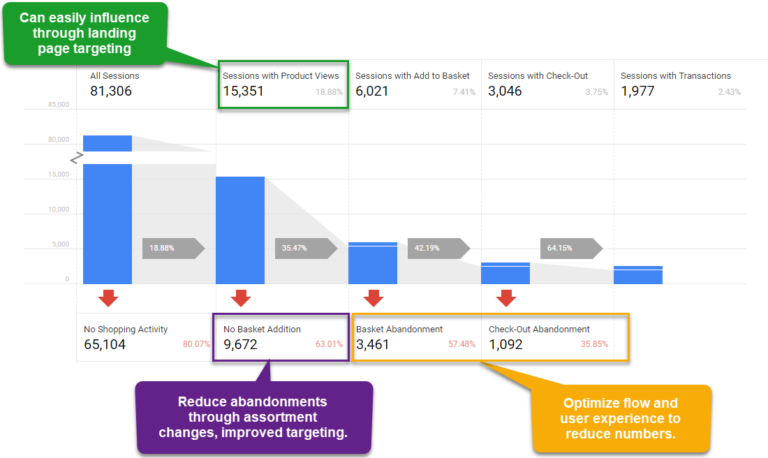
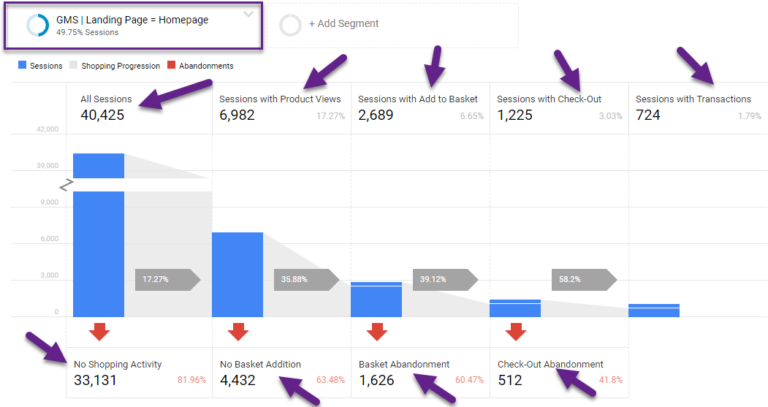
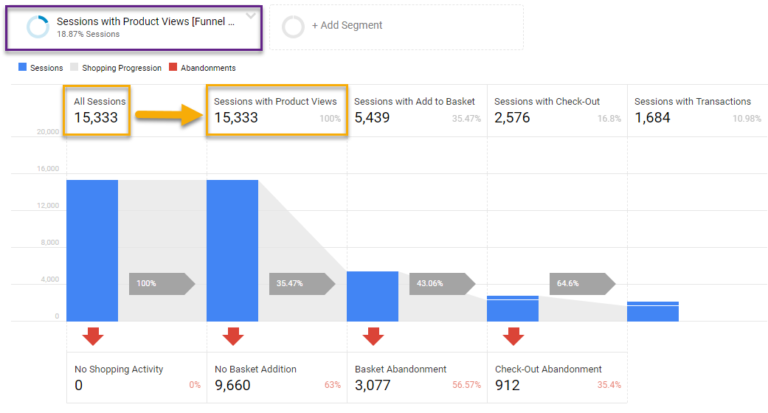
Here is what you will see:
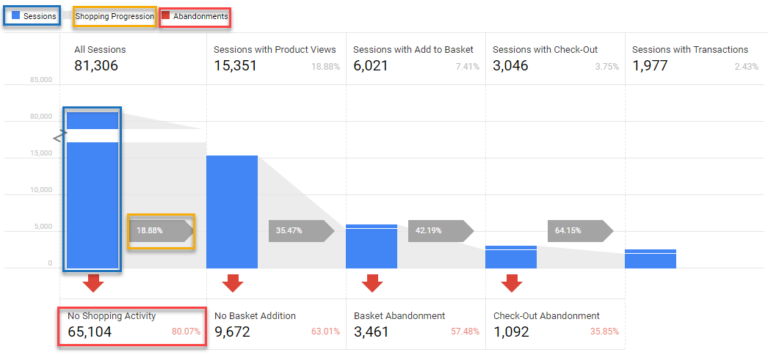
- The colour “blue” reveals all sessions at each stage.
- The Shopping Progression percentage is calculated by dividing Sessions with [Action] by All Sessions.
- (Sessions with Check-Out) / All Sessions) = 3,046/81,306 = 3.75%.
- The Abandonments percentage is calculated by dividing Sessions with [No Next Step Activity] by All Sessions at Current Step.
- (Sessions with No Shopping Activity) / All Sessions = 65,104/81,306 = 80.07%.
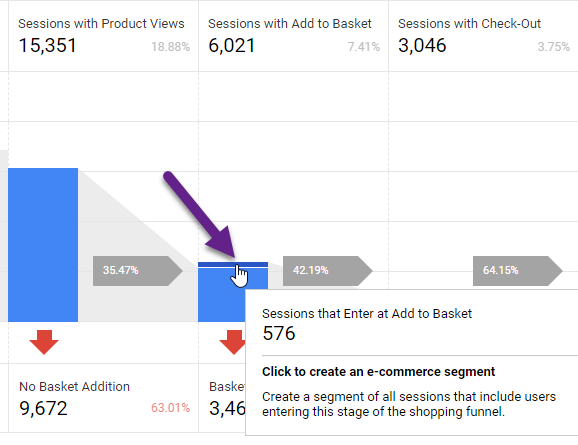
These are the most basic numbers you should understand. Further, you can identify how many users entered at each step (example shown below).
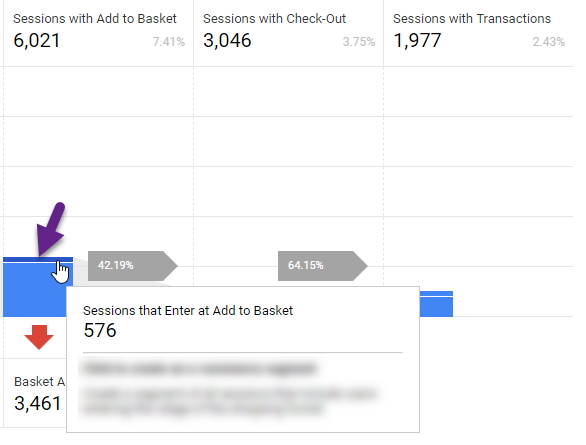
- In 9.6% of all sessions (576/6,021) a visitor enters at Add to Basket.
- In 90,4% of all sessions (5,445/6,021) a visitor goes to Add to Basket after seeing a product detail page.
How Enhanced Ecommerce shopping-stage dimensions map to funnel-step metrics:
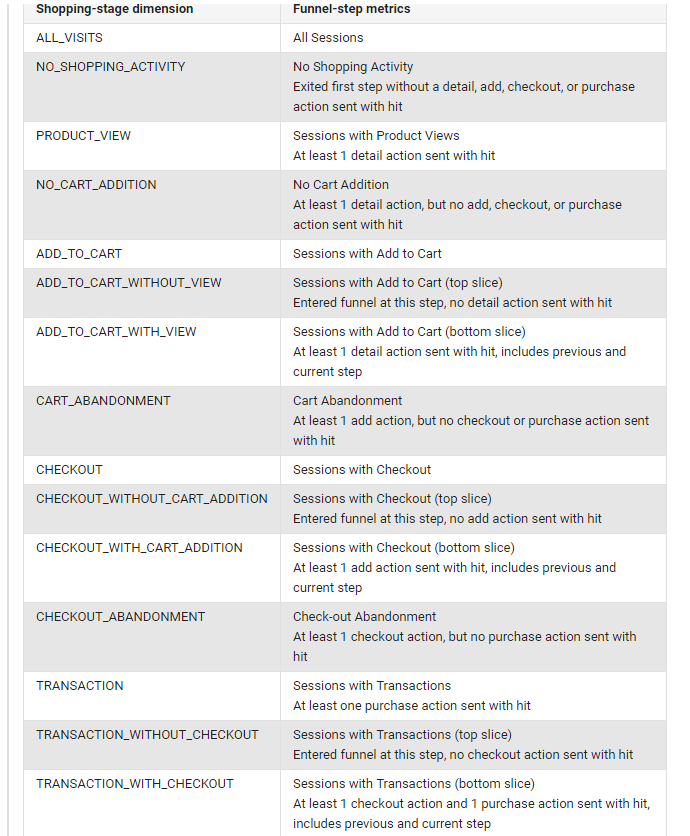
Later in this article, you will find out how to make this shopping-stage dimension overview incredibly useful.
Note: the Shopping Behaviour Analysis funnel is different from Google Analytics goal funnels. These goal funnels work with “backfilling” previous steps during a session where the shopping behaviour reports behave differently.
Basic Shopping Behaviour Analysis
Now that you understand the basics, let’s dive into a basic analysis of this Enhanced Ecommerce report.
The Shopping Behaviour Report allows you to see your visitors’ flow through the various stages of your site’s shopping experience.
1. Aggregated Shopping Behaviour Data
You will want to analyse the overall data first to see what’s going on.
Now, you might want to answer questions like:
- Which device is performing worst on which step?
- Which channel drives visitors to the first step, but not much further?
- Do we have any browser issues at a certain step?
2. Segmented Shopping Behaviour Data
This is where the report that is shown below the aggregated numbers comes in scope:
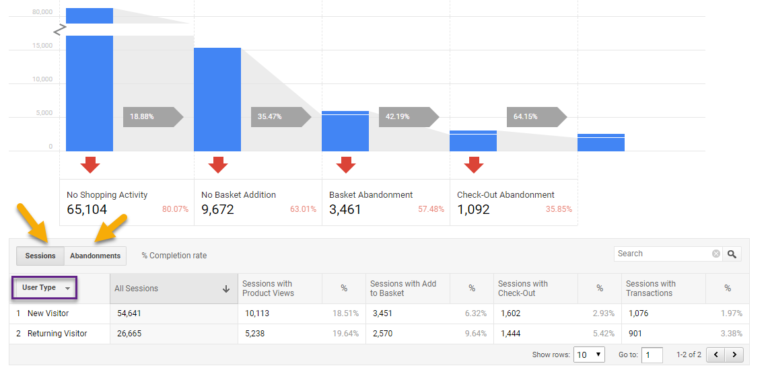
The dimension shown on default is “User Type”:
- Based on GA cookie.
- Same device, browser.
- No incognito browsing, cookie deletion.
Just be aware of that!
The numbers above reveal that returning visitors:
- Relatively don’t view one or more products more often. // not taking into account landing page effect
- Are more likely (53% higher perc.) to add a product to basket.
- Are are far more likely (85% higher perc.) to enter the check-out.
- Are are far more likely (72% higher perc.) to buy a product.
Further, you could make an abandonments analysis:
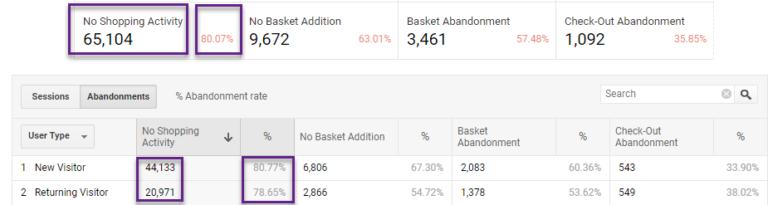
Google has done a great job by adding a list of default dimensions and custom dimensions where you can segment on.
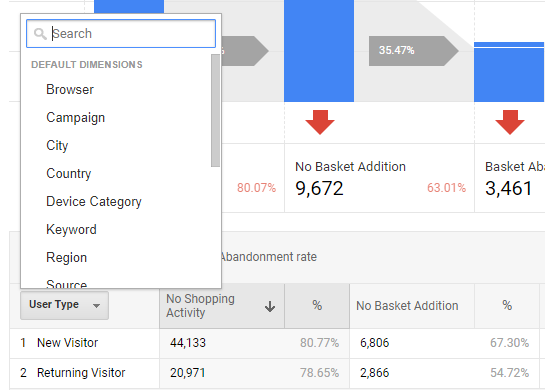
You could more quickly spot “dimension” issues/challenges and opportunities by segmenting on these dimensions.
I hope you see the clear advantages of using this report over just looking at a conversion rate metric. You can get many more performance insights quickly. And in addition, the regular Google Analytics funnel report can’t be segmented on.
Want some extra practice? Segment the data to find out how the Merchandise Store performs regionally and on the device level? A lot to optimize right!
Pro Shopping Behavior Analysis
Most probably by now you already know more about how to use these reports than most people do. And the exciting stuff still has to come! Let’s go!
1. Apply Custom Segmentation to SBA Report
A basic understanding of Google Analytics segments and knowledge about regular expressions is very handy if you want to dive deeper.
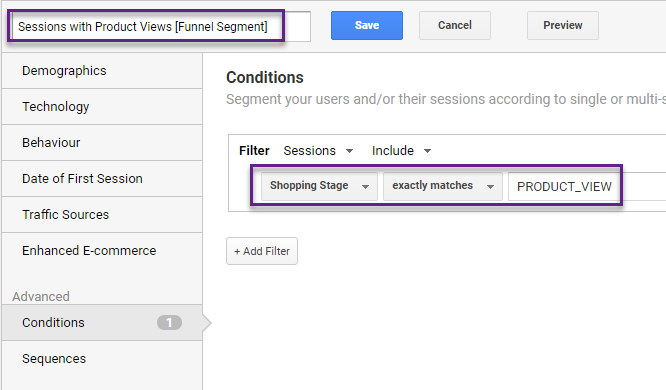
Earlier in this article I mentioned about inflated/unreliable numbers for “Sessions with Product Views”. This is because you can partly control this number by sending or not sending traffic directly to this page. Two segments you will want to create:
- Sessions where landing page equals a product detail page.
- Sessions where landing page doesn’t equal a product detail page.
This helps you to analyse the entire shopping funnel in a more meaningful way. Create your segment in the following way:
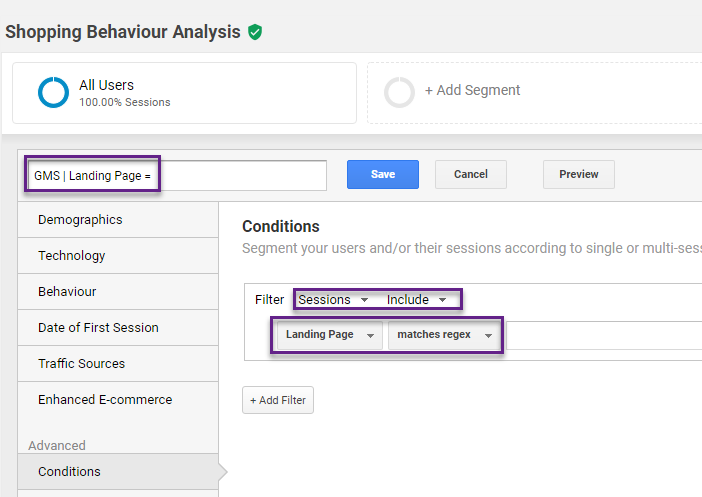
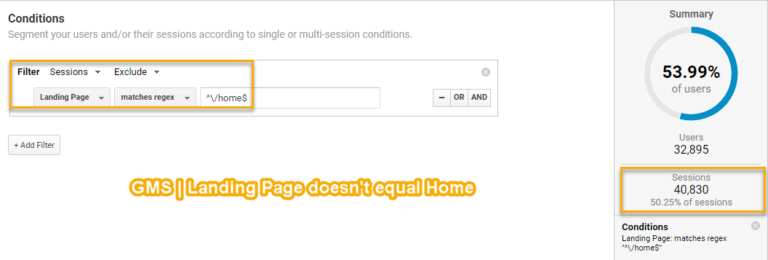
It is required that your website structure or other taxonomy allows you to accurately segment on the desired set of pages. For the Google Merchandise Store it’s hard to quickly retrieve this information. For demonstration purposes, I will show how it works for the homepage (“include” and “exclude” segment).
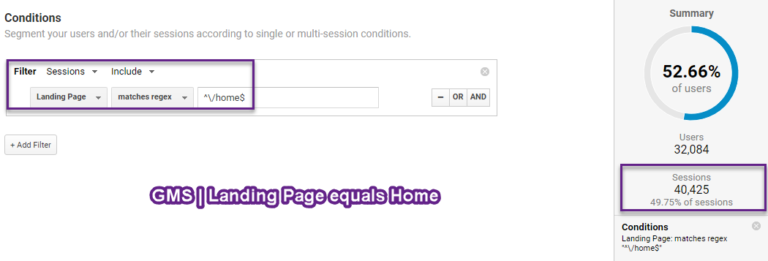
Note: apply one segment at a time to the Shopping Behaviour Analysis report.
Now you can review (and compare to other segment) the flow percentages of sessions with “landing page” equals “home”. If you haven’t used them yet, make sure to learn about sequential segments as well. They might come in handy here! You can get the information in Excel, Google Sheets or any other external application of your choice.
Eventually, the best insights come from segmenting your data and using this information to optimize your channels and platform. The possibilities are endless, but always keep in mind that you do an analysis with the primary purpose of learning something and/or answering a business question. Otherwise you can easily get lost in all data that is available.
2. Create Funnel Segments
Most people that I have worked with didn’t hear about funnel segments before.
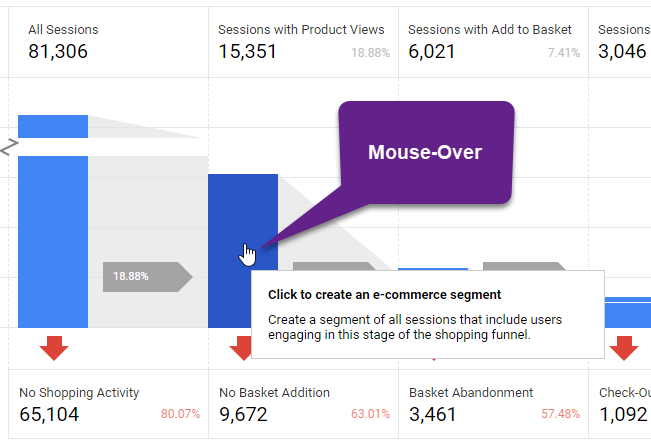
This is how it works:
Step 1: go to Shopping Behaviour report and go with your cursor to one of the funnel steps.
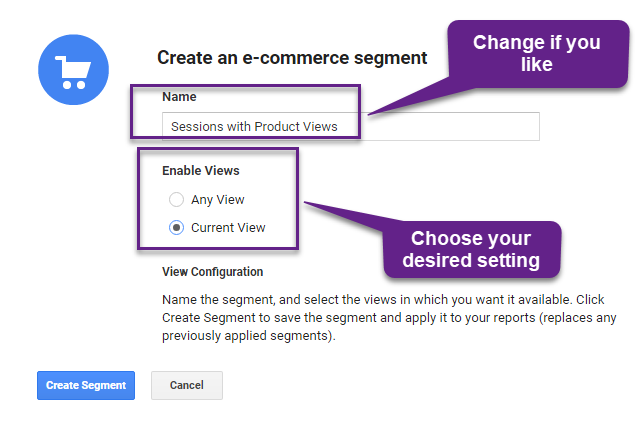
Step 2: create the actual segment.
Step 3: you can review the segment after you have created it.
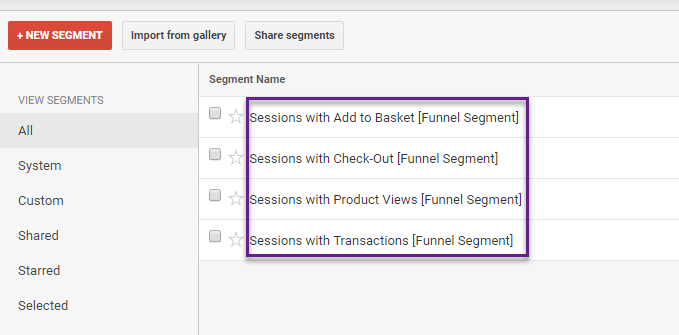
You can create three more segments in a minute:
- Sessions with Add to Basket.
- Sessions with Check-Out.
- Sessions with Transactions.
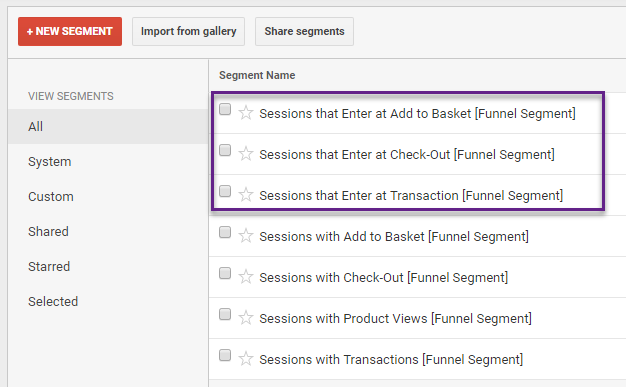
And here they are:
If desired, and for future analysis, you can create a few more segments out of the funnel report:
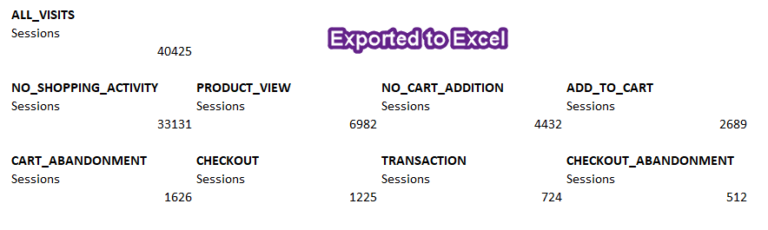
And the corresponding data set is shown below:
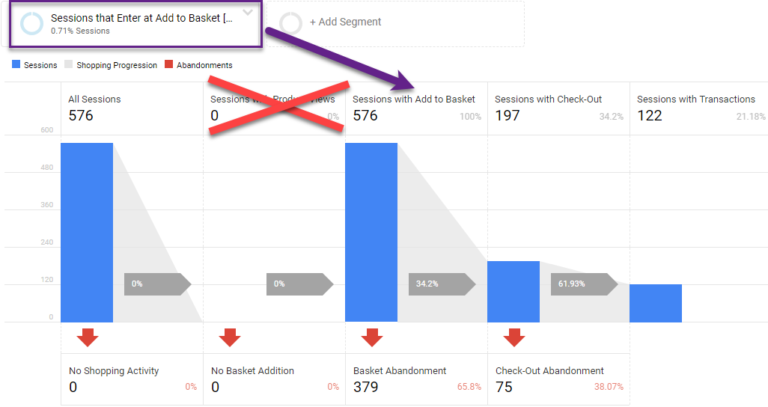
As expected, in this funnel report there are no “Sessions with Product Views”.
Now we have seven segments:
And manually we could even create more segments. For example, “Sessions with Add to Basket excluding Sessions where people entered on the Add to Basket page”. But let’s not make it overly complex! Last thing, as previously mentioned the segments are based on the “Shopping-stage dimension”.
By now, you should know:
- How the Shopping Behaviour Analysis report works.
- How you can make a basic analysis.
- How you can create funnel segments.
Now it’s time to go one step further: applying the segments to reports for customer (intention) insights.
3. Use Funnel Segments
The great thing is that you can apply the funnel segments to nearly all reports in Google Analytics. And you can correlate them to any (custom) dimension in Google Analytics.
Two drawbacks of the Shopping Behaviour Analysis report are:
- There is a fixed pre-set of dimensions and custom dimensions to correlate your metrics to.
- You can analyse the funnel on just one segment at a time.
Example of Use Case
- I want to quickly compare the Ecommerce CR% of different channels (Default Channel Grouping report).
- Thereby I like to focus on sessions with actions “Add to Basket”.
Step 1: navigate to Acquisition > All Traffic > Channels.
Step 2: select segment “Sessions with Add to Basket [Funnel Segment]”.
Step 3: remove default “All Users” segment.
Step 4: select E-commerce tab to focus on these metrics.
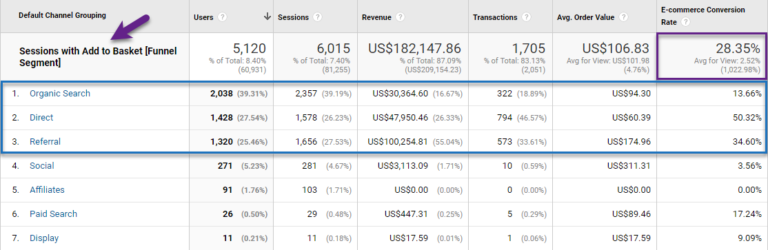
The overall Ecom CR% for this segment is 28% with large differences across the various channels.
- Organic Search converts at 14%.
- Referrals (bulk) converts at 35%.
- Direct converts at 50%.
The reliability of the measurements is out of scope here, but the data can reveal useful insights of customer intention on a more granular level.
You can add and compare multiple funnel segments and apply them to the channel, device category, country dimension or any other dimension of your choice. This to find out more about segmented customer intention, customer challenges and opportunities to get the most out of your website and campaigns.
Usually, you will want to get your data out of Google Analytics and analyse it in Google Sheets or a different application.
Selecting multiple segments at once and analysing them across many dimension values can become a real challenge inside Google Analytics.
This is where the Google Analytics API becomes your best friend!
![]()
Related Posts
Event Tracking in Google Analytics / GTM
Event Tracking is one of the most important features in Google Analytics.…
How to Set Up Google Analytics 4 & Use It
GA4 is built off the backbone of the App + Web platform (aka Firebase). GA4…

Setup Enhanced Ecommerce Events in Google Tag Manager
Enhanced Ecommerce is certainly one of the finest reporting user interface…